The 9-box talent grid is one of the most widely adopted tools for assessing talent. It plots employees across two axes - performance and potential - and produces a snapshot that is supposed to guide succession planning, development investment, and leadership pipeline decisions.
In practice, the grid is frequently misread, misapplied, or treated as an end in itself rather than a starting point. This article explains what the 9-box actually measures, where it breaks down, and how to use it as a genuine strategic tool rather than a calibration exercise that ends in a spreadsheet.
What the 9-box measures
At its core, the 9-box grid categorises employees across two dimensions:
How consistently someone delivers results in their current role. It is backward-looking - a record of what has been achieved.
Capacity for growth. Most reliably assessed through learning agility - how quickly someone absorbs new information and adapts to complexity. It is forward-looking and, by definition, harder to measure than performance.
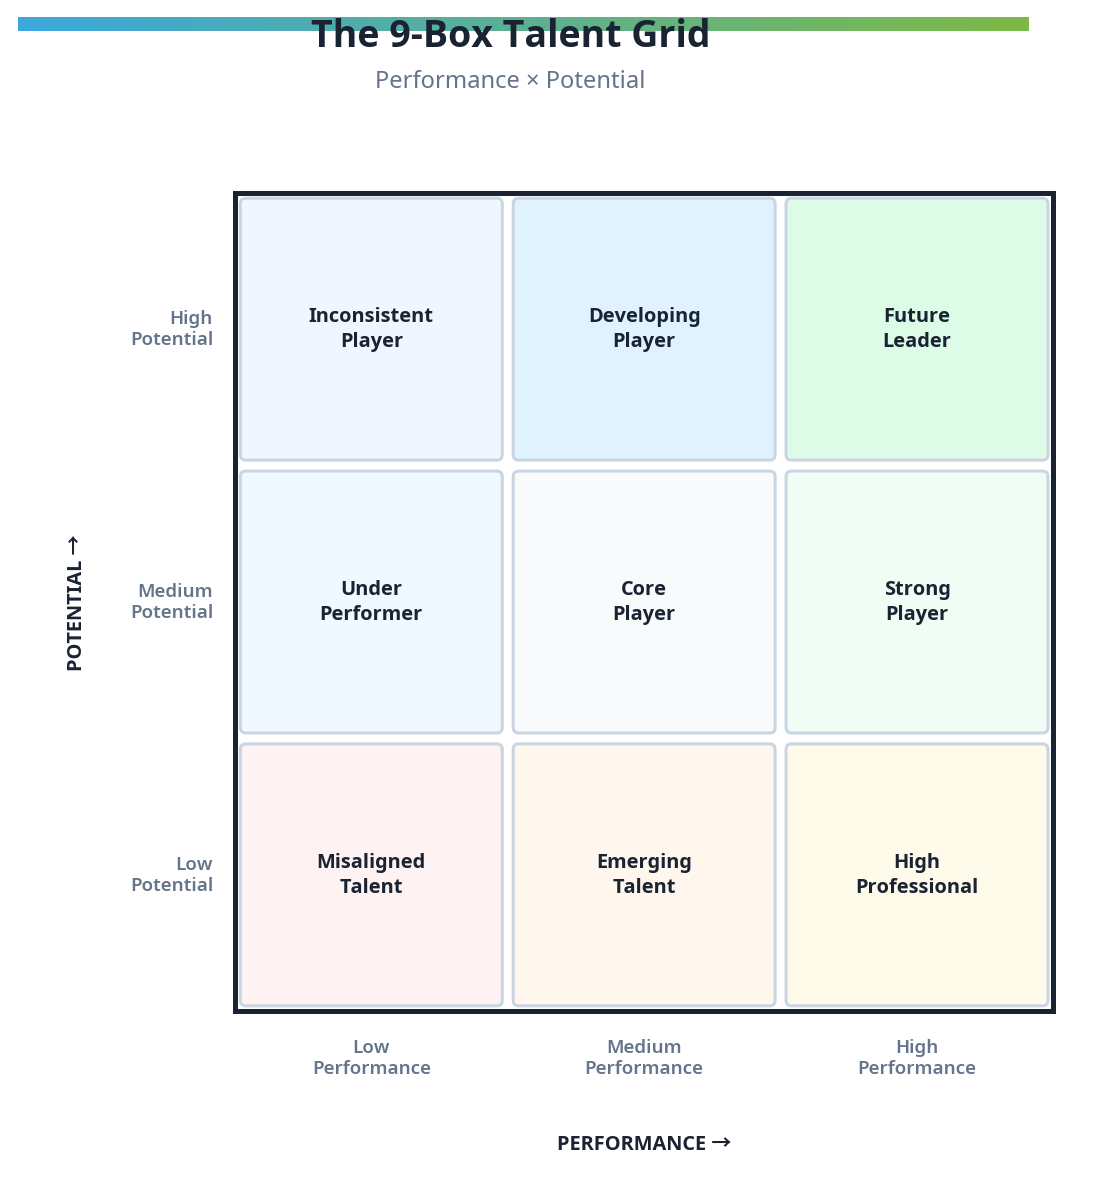
The real value of the 9-box grid is not in labelling individuals - it is in showing you the shape of your leadership supply relative to your organisation's demand.
Using the grid strategically
The most common mistake organisations make with the 9-box is treating it as a static snapshot. Used well, it is a leadership forecasting tool - one that should shift in response to your business environment.
Consider two scenarios. A company entering a rapid growth phase needs a deep bench of high-potential leaders ready to step into expanded roles. A company in a contraction phase does not - over-developing leaders in a declining market creates flight risk, frustration, and wasted investment.
The grid allows you to calibrate your development focus accordingly. The three scenarios below illustrate what the target distribution should look like under different business conditions.
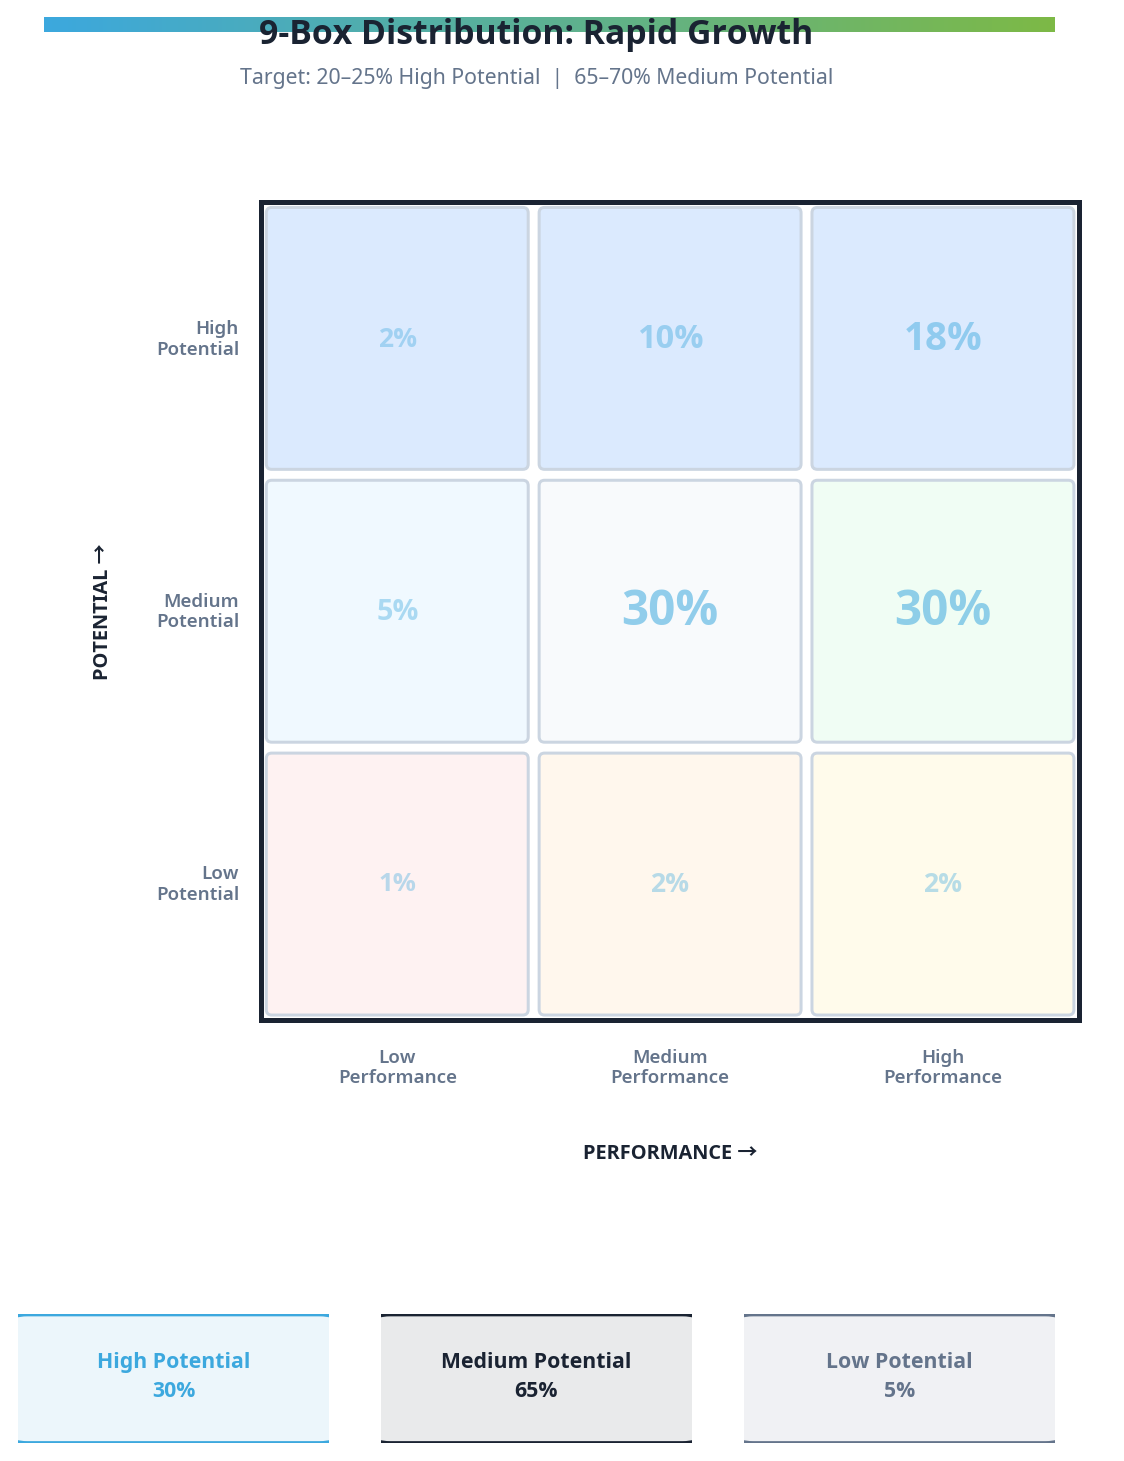
Rapid growth
When your business is scaling quickly, aim for 20–25% of your talent in the top-right quadrant (high performance, high potential) and 65–70% in the middle tier. You need to build leadership capacity ahead of demand, not in response to it.
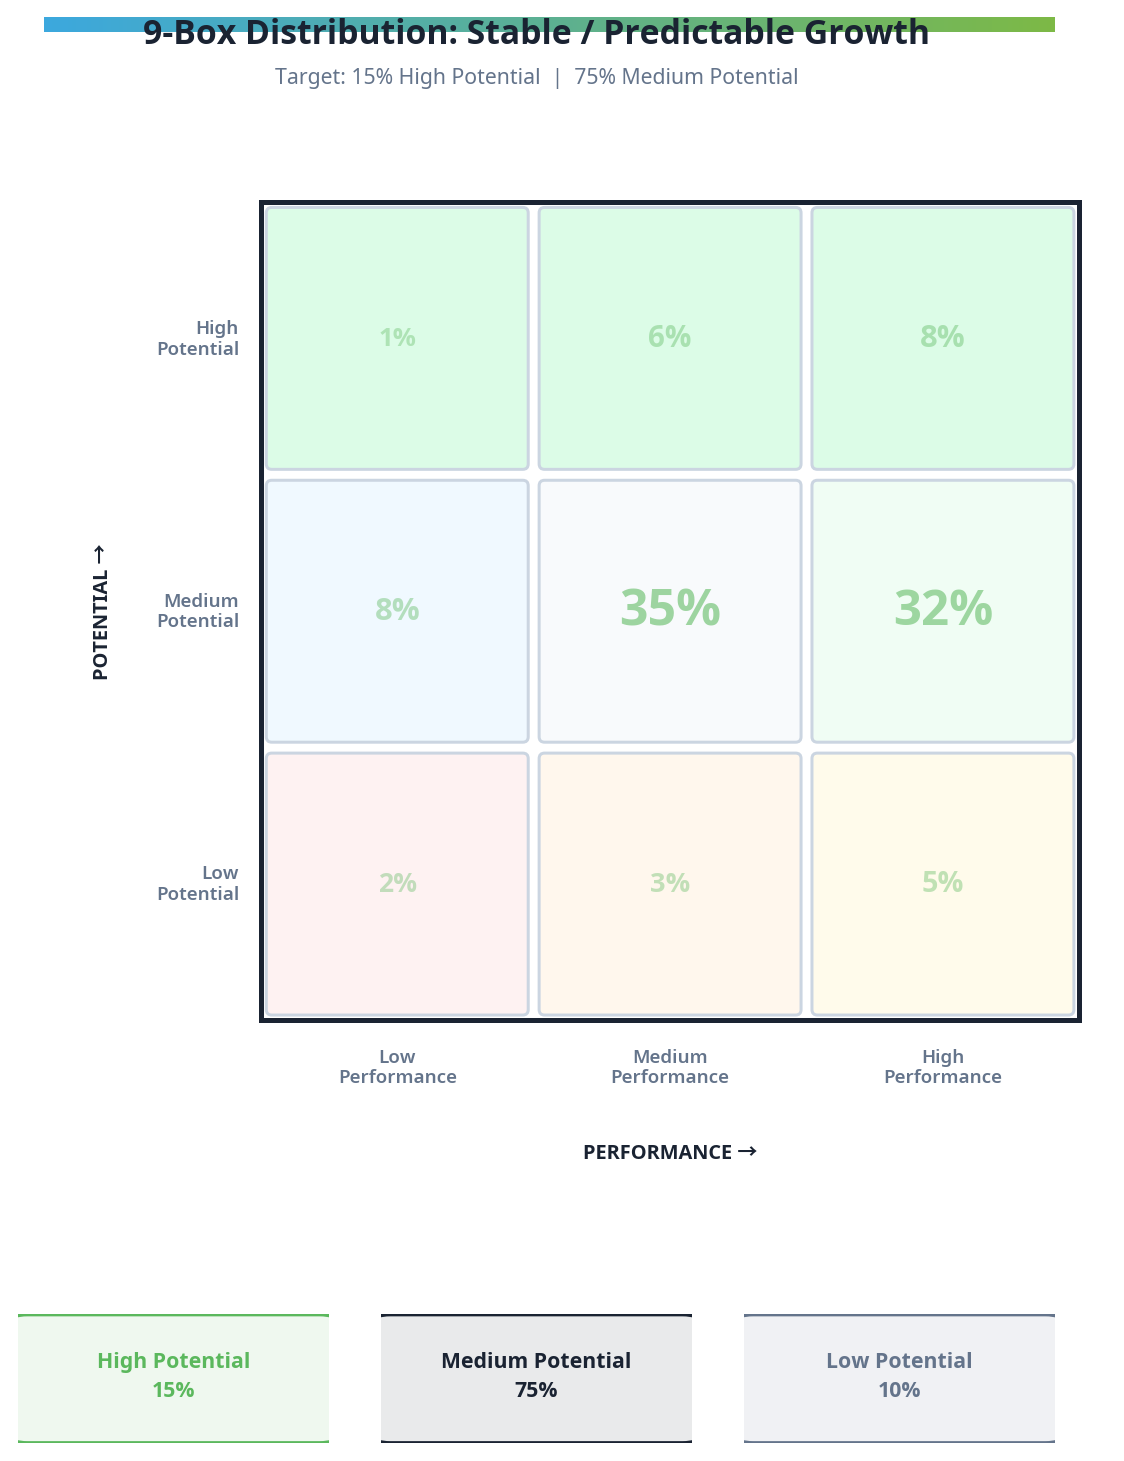
Stable, predictable growth
In a stable environment, the right distribution shifts to approximately 15% high potential, 75% medium potential, and the remainder in lower-demand development zones. The goal is to keep your bench strong without over-investing in development that outpaces your actual leadership demand.
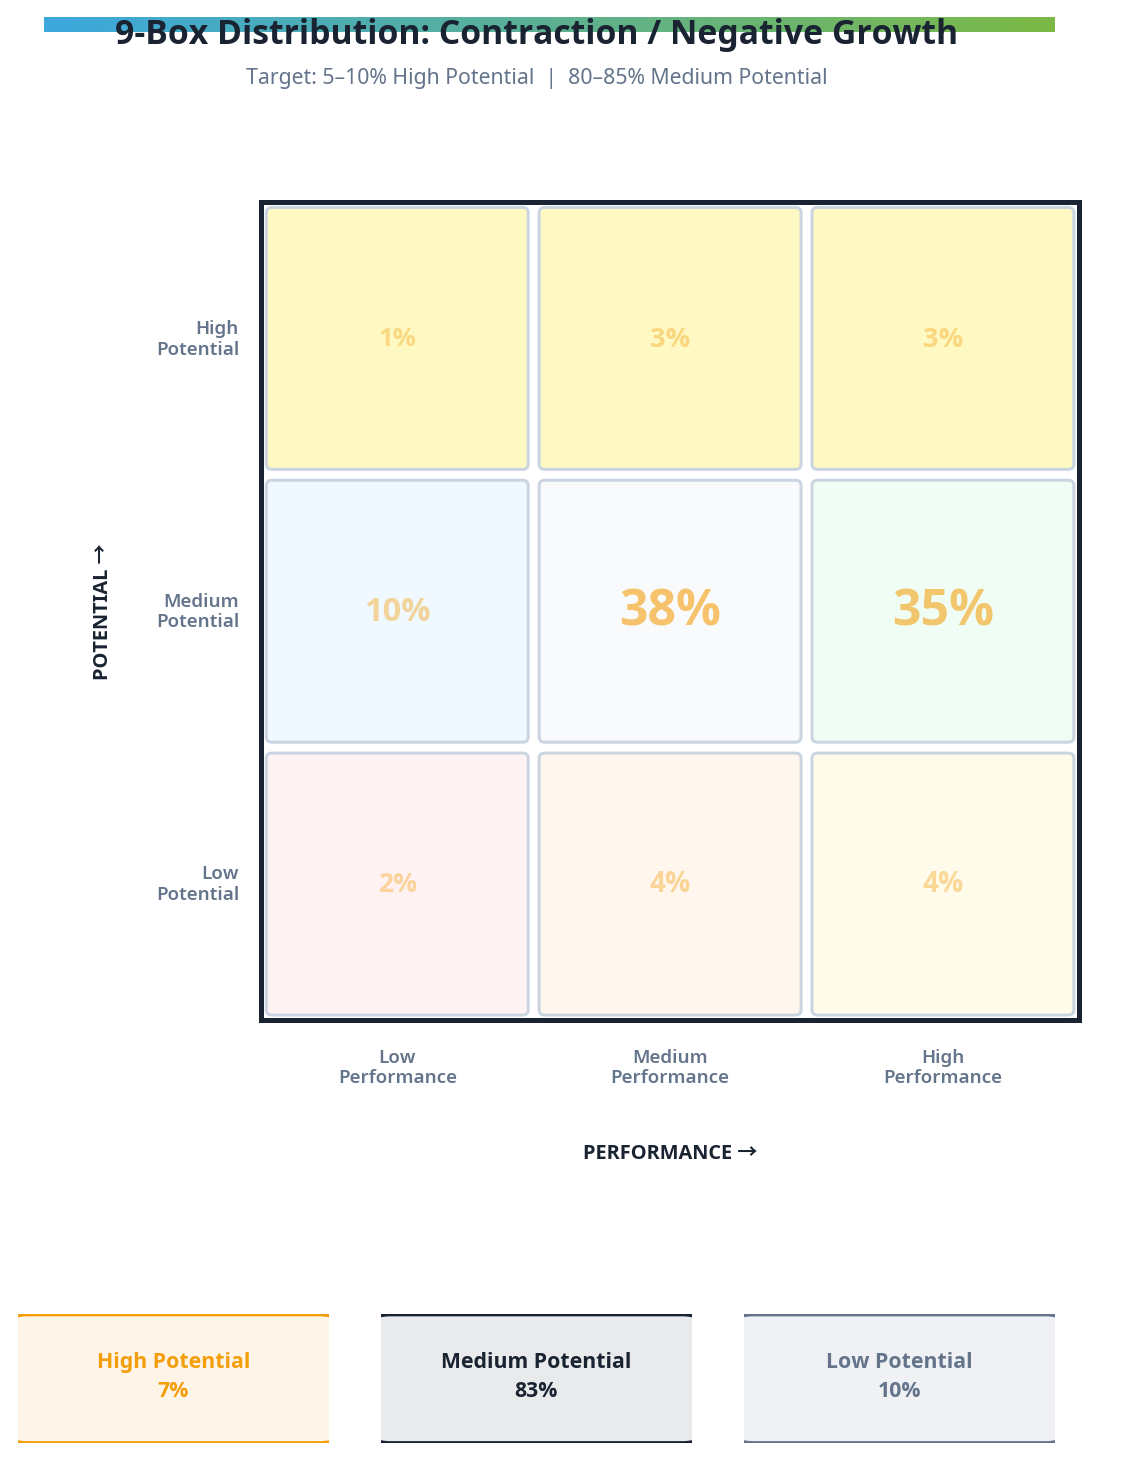
Contraction or negative growth
During a contraction phase, scale back to 5–10% high potential, with the majority of your talent in medium potential areas. Too many high potentials in a shrinking organisation creates a retention problem - people who are ready for more will leave if more is not available.
| Business Condition | Target % in High Potential | Why It Matters |
|---|---|---|
| Rapid Growth | 20–25% | You need to scale leadership capacity ahead of demand. |
| Stable / Predictable | 15% | Keep your bench strong, but don't over-invest. |
| Contraction / Decline | 5–10% | Too many high potentials = flight risk. |
Two misunderstandings that undermine the grid
1. Potential is not the same as promotability
The most common error in 9-box calibration sessions is conflating potential with promotability. They are not the same thing.
Promotability
Readiness to step into a new role now. A near-term assessment based on current capability gaps.
Potential
Capacity to grow into larger, more complex roles over time. A longer-range assessment based on learning agility.
An employee can be highly promotable today - ready for the next role - but have limited upward potential beyond that. The grid helps you see this distinction and avoid two common errors: over-promoting people who are ready now but will plateau quickly, and overlooking people who are not yet ready but have significant long-term upside.
2. The opposite of high potential is not low potential
What happens to the employee placed in the top-left cell - high performance, low potential? In most organisations, that label carries an implicit message: "We value what you do, but we don't see a future for you here."
"The opposite of high potential is not low potential. It is high professional."
High professionals are not on a leadership trajectory, but they deliver deep expertise, build long-term client and internal relationships, and accumulate institutional knowledge that is genuinely difficult to replace.
A well-designed talent review recognises both groups. High potentials need development investment and stretch assignments. High professionals need recognition, retention strategies, and roles that leverage their depth rather than pushing them toward breadth they do not want.
What the grid cannot do alone
The grid is a useful diagnostic. It is not a talent strategy.
If your talent review ends with a completed 9-box and no follow-up action plan, you have run a calibration exercise, not a talent process. The grid tells you where people are. It does not tell you what to do about it, how to develop them, or whether your pipeline is actually aligned to your business strategy.
To move from a snapshot to outcomes, the 9-box needs to be embedded in a broader process that includes:
How Peopletree Group applies the 9-box
At Peopletree Group, the 9-box is one input into a broader talent review process - not the centrepiece of it. We use it alongside behavioural assessment data from Talentprint, capability frameworks from the Talent Genome, and people analytics from DataHub to produce a view of talent that is grounded in evidence rather than manager perception alone.
The six capabilities required to make a talent review process actually work are:
A structured process that connects the grid to business priorities and succession decisions.
A platform that collects, stores, and surfaces talent data consistently across the organisation.
Clean, comparable data that allows calibration across managers, teams, and geographies.
Structured calibration sessions that surface bias and produce consistent assessments.
Translating grid outputs into individual development plans and pipeline actions.
Tracking movement on the grid over time to assess whether development investment is working.
The 9-box is a starting point. What you do with it determines whether it becomes a genuine leadership forecasting tool or an annual exercise that produces a chart and little else.